



Why this use case matters
Tree canopy is not just an environmental metric. It is planning data.
In dense urban areas, canopy coverage affects shade, surface temperature, walkability, public health exposure, and neighborhood resilience during heat events. If a city wants to reduce heat risk, it needs more than a general commitment to planting trees. It needs location-specific evidence.
That is where this AI use case becomes interesting. The USC approach appears designed to help public agencies answer questions such as:
- Which blocks have the weakest canopy coverage?
- Where could new trees deliver the highest local benefit?
- How does canopy change over time?
- Which neighborhoods have been historically underserved?
Instead of treating urban forestry as a citywide estimate, the tool helps frame it as a map-based intervention problem.
What the USC tool actually does
Based on the available description, the system uses free aerial imagery from the U.S. Department of Agriculture’s National Agriculture Imagery Program and combines it with an ArcGIS deep learning model to map tree canopy.
That matters because many high-accuracy approaches depend on lidar, which produces detailed 3D landscape data but can be expensive to acquire and process. USC’s model offers a lower-cost route to actionable canopy maps by using data that is already broadly available.
The project includes two related tasks:
- Tree canopy mapping, which identifies areas covered by trees
- Individual tree detection, which tries to identify separate tree crowns in aerial imagery
The second task is harder. From above, trees can overlap, appear small, or blend into surrounding vegetation and built surfaces. Even so, the description suggests the individual-tree model performed competitively against more expensive lidar-based approaches.
The core workflow behind the use case
For AI adopters, the real question is not whether the model is technically interesting. It is whether the workflow is usable.
This one is unusually practical because the data source is public and the output is tied to a familiar GIS environment. At a high level, the workflow looks like this:
- Gather recent aerial imagery for the target area.
- Run the ArcGIS deep learning model on that imagery.
- Generate canopy maps and, where useful, individual tree detections.
- Review results against local knowledge or existing GIS layers.
- Use the outputs to prioritize planting, maintenance, or shade-planning decisions.
That workflow is attractive because it lowers two barriers at once: data cost and machine learning complexity. A municipality does not need to start from scratch with model development to begin testing the approach.
Where this tool fits in a real urban forestry stack
This is not a full urban climate platform by itself. It is a decision-support layer.
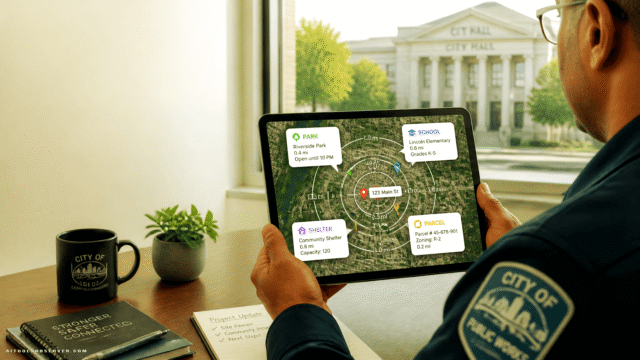
In practice, cities could combine canopy maps with other datasets to build better intervention plans. Useful pairings might include:
- Heat vulnerability maps
- Population density
- School and park locations
- Street-level right-of-way data
- Public health indicators
- Existing planting inventories
- Maintenance capacity and watering access
The result is more than a map of trees. It becomes a way to rank where new canopy is likely to matter most.
A city, for example, could identify school blocks with low shade coverage, high pedestrian activity, and elevated heat exposure. That creates a much sharper investment case than simply saying a district “needs more trees.”
Why the cost structure changes adoption
The most important feature here may be the input economics.
A lot of public-sector AI discussion focuses on model performance first. In municipal operations, that is often the wrong order. Adoption usually depends on whether a workflow can be repeated cheaply, explained clearly, and integrated into existing planning tools.
Using free aerial imagery helps on all three fronts:
- Cheaper to start than lidar-dependent programs
- Easier to repeat over time as new imagery becomes available
- More accessible for departments without dedicated remote-sensing budgets
That does not mean aerial-imagery-based mapping replaces lidar in every case. Lidar still offers depth and structural detail that 2D imagery cannot fully provide. But for many cities, a lower-cost model that is good enough to guide planting decisions may be more useful than a higher-cost system they cannot regularly deploy.
What makes this credible beyond a single neighborhood test
One common weakness in applied AI projects is geographic narrowness. A model works in one place, under one visual environment, and fails when moved elsewhere.
The USC team tested the system in Boyle Heights and City Terrace in Los Angeles, then applied the trained models to neighborhoods in San Francisco and Phoenix without additional retraining. The reported consistency across different urban settings suggests the approach may travel better than many place-specific models.
That is significant for practitioners. A city evaluating the tool does not want to fund custom model training before seeing any value. A model that can be applied more directly across climates and urban forms is much easier to pilot.
Careful readers should still treat portability as something to validate locally. Tree species, seasonal imagery variation, development patterns, and visual clutter can all affect output quality. But the early cross-city applicability is one of the more practical signals in the project.
The strongest use cases for municipalities
Not every city needs the same level of forestry intelligence. This tool seems especially well suited to a few clear use cases.
1. Heat mitigation planning
If extreme heat is the driver, canopy maps help identify places where shade deficits are likely contributing to risk. That gives cities a concrete way to target planting rather than spreading resources evenly.
2. Equity-focused greening programs
The project’s testing in historically lower-canopy neighborhoods points to a broader planning use: identifying communities that have been persistently under-covered and directing investment accordingly.
3. Grant applications and budget justification
A map-backed case is easier to defend than a general narrative. Agencies can use canopy evidence to support funding requests, planning documents, or resilience programs.
4. Change detection over time
Because the imagery source is periodically updated, cities may be able to track canopy shifts across years. That supports evaluation: where planting programs are working, where canopy is declining, and where maintenance gaps are emerging.
Tradeoffs and limitations to keep in view
This is a strong use case, but it is not magic.
Aerial imagery can support detailed mapping, yet it still has constraints compared with lidar. It is better to understand those upfront than to overread the output.
Key tradeoffs include:
- Less structural detail: 2D imagery does not directly capture canopy height or full three-dimensional form.
- Occlusion and overlap: Dense urban tree crowns can blend together, making individual tree detection harder.
- Image timing matters: Seasonal conditions, shadows, and image quality can affect model performance.
- Operational verification is still needed: Planning teams should review results against local reality before making investment decisions.
The next step described by the researchers is therefore logical: pairing the AI approach with freely available lidar data to estimate canopy height and shade more precisely. That would move the workflow closer to a richer urban cooling model rather than a canopy-extent map alone.
How AI adopters should evaluate tools like this
If you work in local government, climate planning, GIS, or environmental consulting, this project is a useful example of how to assess applied AI beyond headline performance.
Look at four things:
Data dependency
Does the tool rely on expensive or hard-to-access inputs, or can your team actually run it at scale?
Workflow fit
Can it plug into the GIS systems, planning processes, and staff skills you already have?
Geographic transferability
Will it work outside the original test environment, or does it need custom retraining?
Decision value
Does the output directly improve a planning decision, or is it merely an interesting visualization?
On those criteria, the USC tool appears well positioned. It solves a defined municipal problem, uses accessible data, and produces outputs tied to real intervention planning.
What this means for the broader AI tools landscape
This is a good reminder that some of the most valuable AI use cases are not flashy consumer apps. They are narrow operational tools that reduce the cost of seeing a problem clearly.
For AiToolsObserver readers, the lesson is broader than urban forestry. When comparing AI tools, especially in public-sector or infrastructure contexts, the best option is often the one that makes existing data more usable at lower cost. Not the one with the most complex model stack.
That distinction matters. Many organizations do not need maximum technical sophistication. They need enough accuracy, enough repeatability, and enough usability to make better decisions next quarter.
Practical takeaway
If your city, nonprofit, or planning team is trying to expand urban canopy but lacks lidar budgets, USC’s approach is worth studying as a low-cost geospatial AI workflow. Its main value is not that it replaces every premium mapping method. Its value is that it lowers the threshold for acting on canopy data now.
The smart next step is simple: treat aerial-imagery AI mapping as a first operational layer, then combine it with local GIS data and field knowledge to decide where the next trees should go.












Comments (0) No comments yet
Want to join this discussion? Login or Register.
No comments yet. Be the first to share your thoughts!