

What Is GraphMaker?
GraphMaker is a web-based AI tool that turns spreadsheets, CSV files, and Google Sheets data into charts in seconds. Instead of configuring chart types and axes manually, you upload your data and describe what you want to see in natural language. The AI then generates bar charts, line charts, scatter plots, pie charts, and histograms that highlight trends and answer your questions.
This makes it easier for business analysts, marketers, founders, and students to explore data, uncover patterns, and present results clearly. Designed for both data-savvy and non-technical users, GraphMaker streamlines data visualization without the overhead of complex BI platforms and helps you communicate insights quickly.
Quick Snapshot
GraphMaker converts raw spreadsheet and CSV data into clear, professional charts using natural language prompts. It removes manual chart setup so anyone can visualize insights fast without complex BI tools.
- Works on
-
- Web
- Pricing Model
- Cannot determine the price.
- Fits on
- Affiliate Program
- We could not identify an affiliate program.
- API Availability
- We could not identify whether an API is available.
- Key Features
-
- Turn spreadsheets into charts in seconds
- Ask data questions in natural language
- Visualize insights without complex BI tools
- Audience
-
- business analysts
- marketers
- founders and startups
- product managers
- data-savvy professionals
- students
- educators
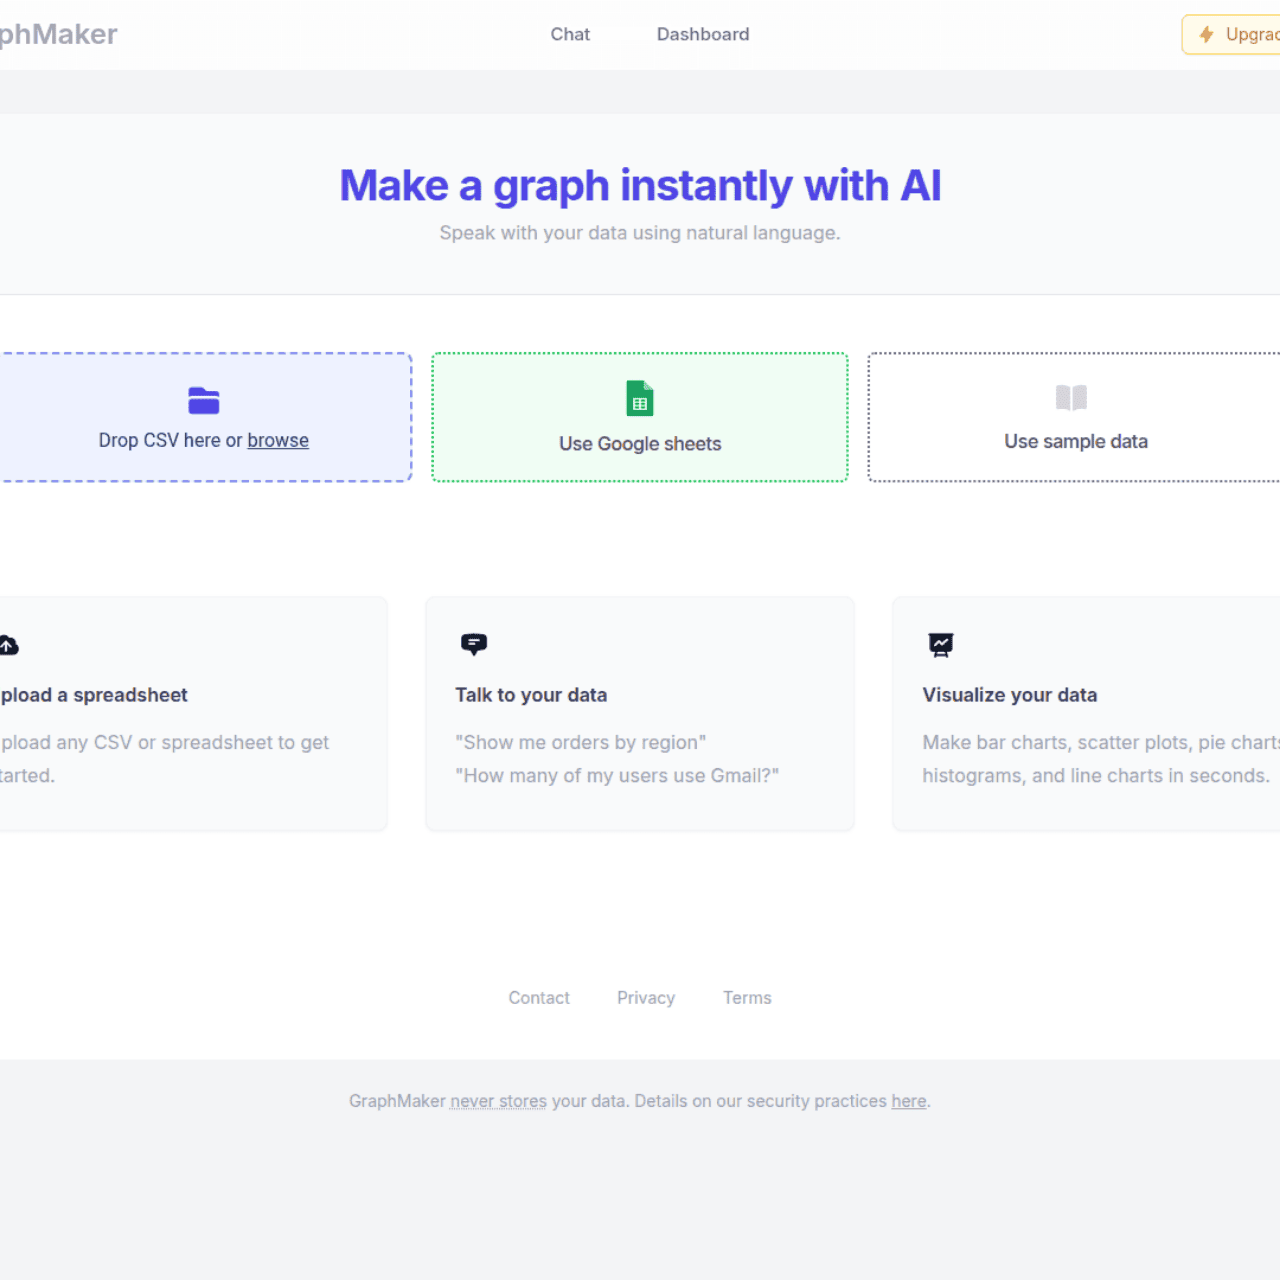
Screenshot

Key Features of GraphMaker
AI-powered charts
Generates graphs from natural language prompts, so you can describe the visualization you want instead of configuring every setting manually.
Spreadsheet and CSV input
Supports uploading CSV files and connecting Google Sheets, allowing you to work directly with the data sources you already use.
Multiple chart types
Creates bar charts, line charts, scatter plots, pie charts, and histograms to cover common reporting and analysis needs.
Conversational data analysis
Lets you ‘talk’ to your data by asking questions in plain language, making it easier to explore trends and answer business questions.
Web-based interface
Runs entirely in the browser, so there is no need to install desktop software or manage complex BI infrastructure.
Use Cases for GraphMaker
Business reporting
Quickly convert spreadsheet-based KPIs and performance data into clean charts, making it easier to share updates with stakeholders without manual chart building.
Marketing analytics
Visualize campaign metrics from CSV exports or Google Sheets to spot trends, compare channels, and communicate results in a more digestible format.
Startup dashboards
Founders can turn raw traction, revenue, and user data into investor-ready charts in seconds, without needing a full BI setup or technical support.
Product metrics tracking
Product managers can upload feature usage or experiment data and use natural language queries to generate charts that highlight patterns and outcomes.
Education and teaching
Students and educators can transform dataset assignments and classroom examples into visualizations that support learning basic analytics and data storytelling.
Frequently Asked Questions
What is GraphMaker and how does it work?
GraphMaker is an AI-powered graph maker that turns spreadsheet and CSV data into charts. You upload or connect your data, then use natural language prompts to generate visualizations like bar charts, line charts, and more.
Which data sources does GraphMaker support?
GraphMaker supports uploading CSV files, connecting Google Sheets, or starting with sample data to quickly generate charts and insights.
Do I need technical skills to use GraphMaker?
No, GraphMaker is designed for non-technical and data-savvy users alike. You simply upload your data and describe the charts or questions you have in plain language.
What types of charts can GraphMaker create?
GraphMaker can generate bar charts, line charts, scatter plots, pie charts, and histograms based on the structure of your data and your natural language prompts.
Is GraphMaker a full business intelligence tool?
GraphMaker focuses on fast, AI-assisted chart creation from spreadsheets rather than full BI capabilities, making it ideal for quick visualizations without complex setup.
How is GraphMaker priced?
GraphMaker includes an option to upgrade to a Pro plan, but specific pricing details are not publicly available in the provided interface, so exact costs are currently unknown.
GraphMaker · Our Verdict
GraphMaker focuses on a narrow but common pain point: turning messy spreadsheets into understandable charts without wrestling with BI software. Its natural language interface lowers the barrier for non-technical users while still supporting a useful range of chart types, making it a practical fit for teams that live in spreadsheets.
GraphMaker ·
-

Hayden AI
Vision AI that keeps city streets moving safely
Research & Data AI - Freemium
Zetta
Automated business intelligence and AI insights in minutes
Research & Data AI - Subscription
Appinion
Turn app reviews into product-ready insight
Sentiment Analysis - Subscription
Querri
AI data analyst for everyone, powered by your data.
Research & Data AI - Subscription
OWOX Data Marts
Hire your AI data analyst and trust every number.
On-Premise AI Analytics - Your Ad Here
- Freemium
Kurby
AI-powered neighborhood intelligence for real estate
Market Research & Analysis -
Keevo
Stop losing traffic to stale content with AI
SEO Writing & Optimization